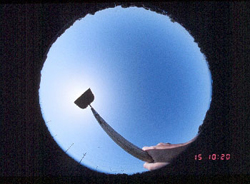
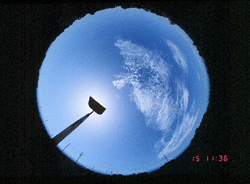
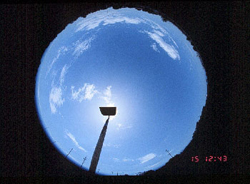
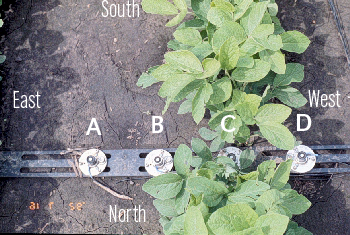
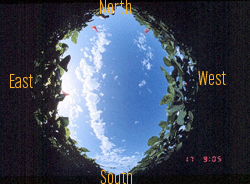
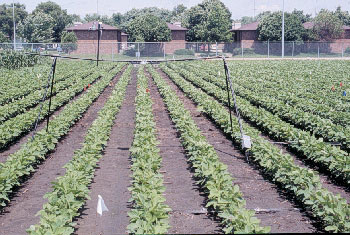
The following data were collected at the University of Nebraska-Lincoln, East Campus research fields on July 15, 1992 over a soybean canopy. The yellow bands in the following graphs represent photographs were taken of sky conditions and a downward looking (nadir) view of the canopy at various locations. Canopy and sky pictures where not taken at the same time but within a short period of each other.
Canopy Picture |
Sky Picture |
|
| 9:48 am | 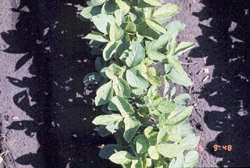 |
Not Available |
| 10:20 am | 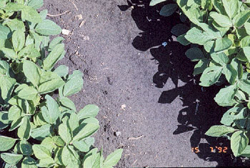 |
 |
| 11:26 am |  |
 |
| 12:38 pm | 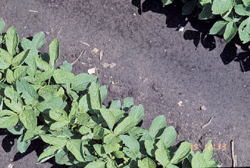 |
 |
| 1:37 pm | Not Available | 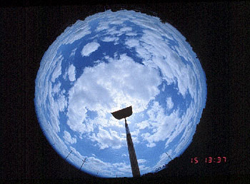 |
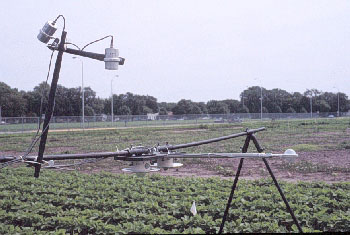
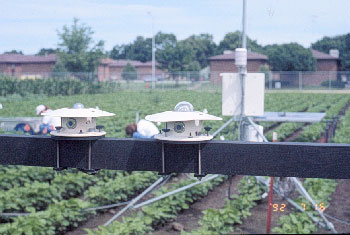
PIR - Epply Pyrgeometer
IRT - Everest Infrared Transducer
 Pyranometer - LI-COR (LI-200SA) Pyranometer
PSP- Epply Precision Spectral Pyranometer
Quantum - LI-COR (LI-190SA) Quantum sensor
Return to the Top
![]() = Incoming Longwave Radiation{Eppley Pyrgeometer}
= Incoming Longwave Radiation{Eppley Pyrgeometer}
![]() = Outgoing Longwave Radiation {Epply Pyrgeometer}
= Outgoing Longwave Radiation {Epply Pyrgeometer}
![]() = Incoming Shortwave Radiation {Epply Precision Spectral Pyranometer}
= Incoming Shortwave Radiation {Epply Precision Spectral Pyranometer}
![]() = Outgoing Shortwave Radiation {Epply Precision Spectral Pyranometer}
= Outgoing Shortwave Radiation {Epply Precision Spectral Pyranometer}
Rn = Net Radiation {REBS Model Q*6 net radiation sensor}
All measurements except "TPAR Average: Measured" where made with LI-190SA Quantum Sensor (hemispherical point source). The "TPAR Average: Measured" values were measured with a LI-191SA Line Quantum Sensor.
 |
 |
Return to the Top
 |
|
 |
|
 |
|
Return to the Top