
Current Climate Summary Maps - HPRCC
The Climate Summary Maps are produced daily using data from the Applied Climate Information System (ACIS). Stations used are from the National Weather Service Cooperative Observer Network (COOP) and the Automated Weather Data Network (AWDN). Maps include total precipitation, precipitation departure from normal, precipitation percent of normal, average temperature, temperature departure from normal, heating degree days, heating degree days departure from normal, cooling degree days, cooling degree days departure from normal, and standardized precipitation index (SPI).

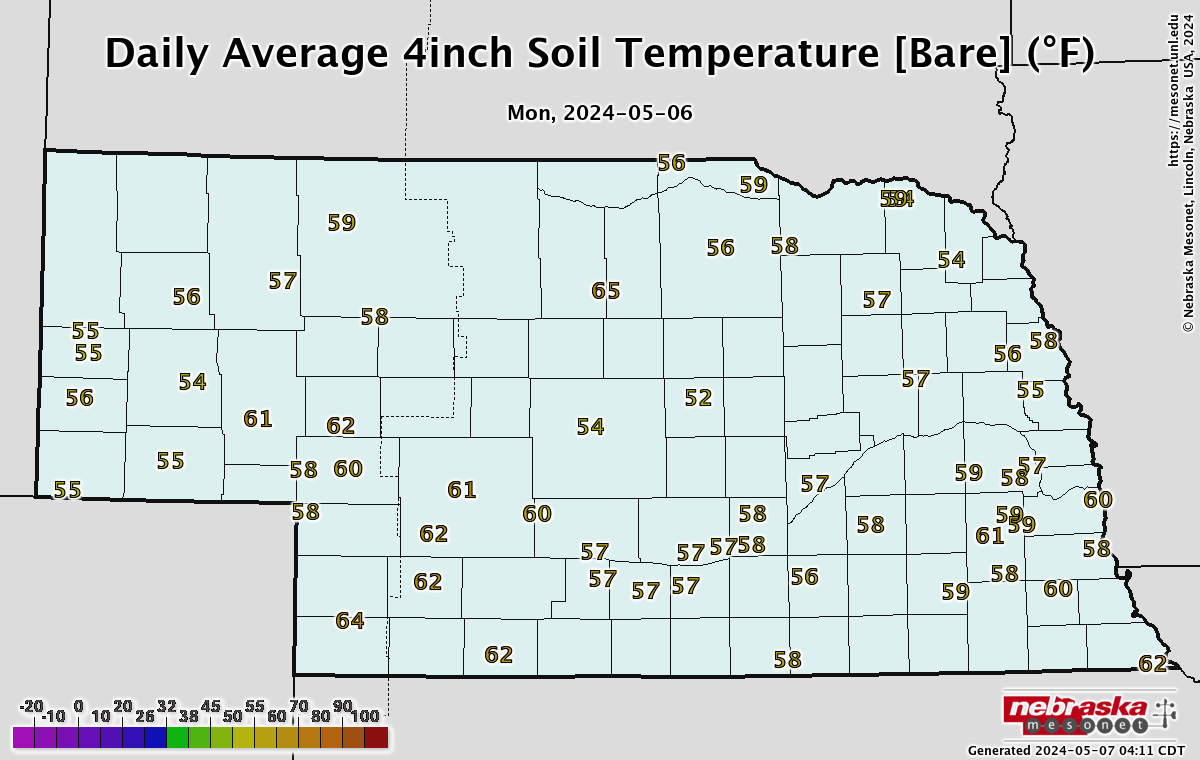
Automated Weather Data Network Maps - Nebraska Mesonet
The AWDN maps show soil temperature, maximum temperature, minimum temperature, total precipitation, relative humidity, solar radiation, wind speed, and potential evapotranspiration for the past 1 or 7 days for the High Plains Region.
Website: https://mesonet.unl.edu/page/datas

Climographs - NDMC
Thirty year monthly averages of precipitation and temperature for selected locations across the United State and around the world.

30 Year Normals Maps - HPRCC
The High Plains Region Normals Maps include maps of precipitation, average temperature, maximum temperature, minimum temperature, heating degree days, and cooling degree days. The 1981-2010 Normals were used to comprise the maps.

Climate Atlas Maps - HPRCC
The High Plains Climate Atlas is composed of a series of maps with various climatic variables being represented. In most instances, 50 years of data were used to comprise the atlas. Maps include mean maximum temperature, mean minimum temperature, precipitation thresholds, last spring freeze, first fall freeze, growing degree days (base 50), total precipitation, total snowfall, heating degree days, and cooling degree days.
Automated Weather Data Network Maps - Nebraska Mesonet
The AWDN maps show soil temperature, maximum temperature, minimum temperature, total precipitation, relative humidity, solar radiation, wind speed, and potential evapotranspiration for the past 1 or 7 days for the High Plains Region.
Website: https://mesonet.unl.edu/page/data

Current Climate Summary Maps - HPRCC
The Climate Summary Maps are produced daily using data from the Applied Climate Information System (ACIS). Stations used are from the National Weather Service Cooperative Observer Network (COOP) and the Automated Weather Data Network (AWDN). Maps include total precipitation, precipitation departure from normal, precipitation percent of normal, average temperature, temperature departure from normal, heating degree days, heating degree days departure from normal, cooling degree days, cooling degree days departure from normal, and standardized precipitation index (SPI).

30 Year Normals Maps - HPRCC
The High Plains Region Normals Maps include maps of precipitation, average temperature, maximum temperature, minimum temperature, heating degree days, and cooling degree days. The 1981-2010 Normals were used to comprise the maps.

Climate Atlas Maps - HPRCC
The High Plains Climate Atlas is composed of a series of maps with various climatic variables being represented. In most instances, 50 years of data were used to comprise the atlas. Maps include mean maximum temperature, mean minimum temperature, precipitation thresholds, last spring freeze, first fall freeze, growing degree days (base 50), total precipitation, total snowfall, heating degree days, and cooling degree days.