
Current Climate Summary Maps - HPRCC
The Climate Summary Maps are produced daily using data from the Applied Climate Information System (ACIS). Stations used are from the National Weather Service Cooperative Observer Network (COOP) and the Automated Weather Data Network (AWDN). Maps include total precipitation, precipitation departure from normal, precipitation percent of normal, average temperature, temperature departure from normal, heating degree days, heating degree days departure from normal, cooling degree days, cooling degree days departure from normal, and standardized precipitation index (SPI).
Website: http://www.hprcc.unl.edu/maps.php?map=ACISClimateMaps
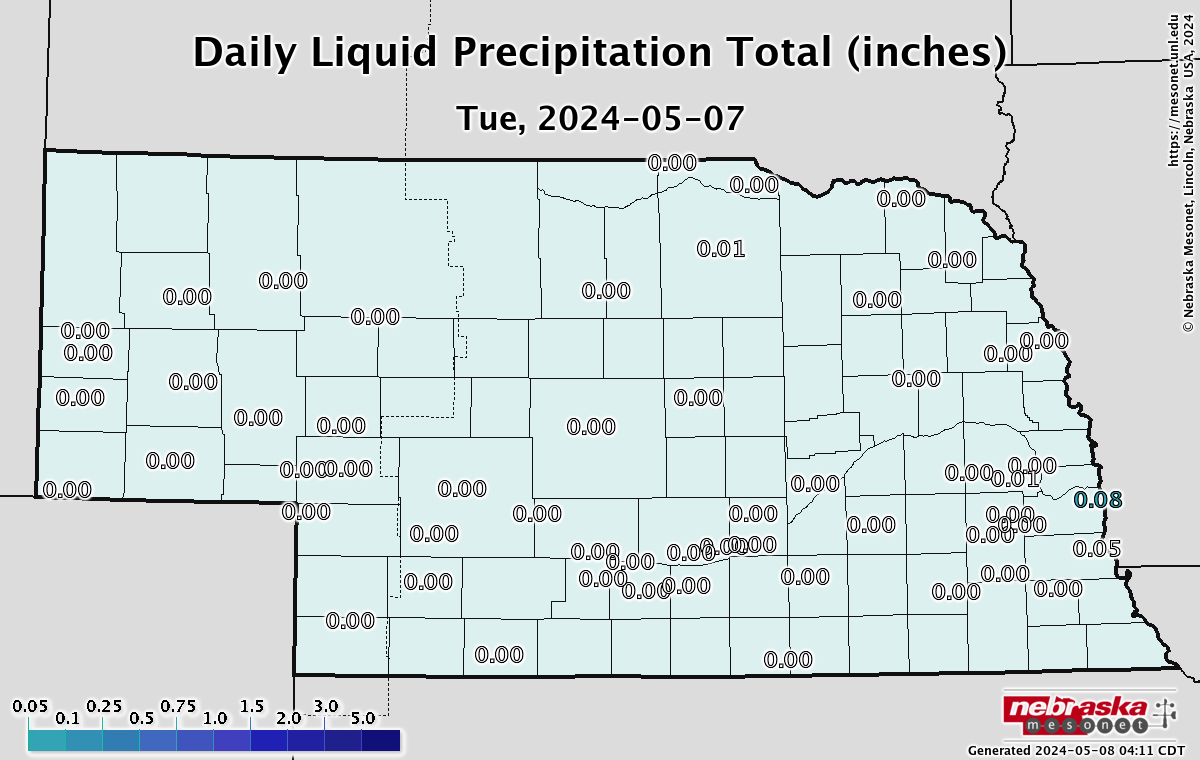
Mesonet - NSCO
The Neraska Mesonet maps show soil temperature, maximum temperature, minimum temperature, total precipitation, relative humidity, solar radiation, wind speed, and potential evapotranspiration for the past 1 or 7 days for the High Plains Region.
Website: https://mesonet.unl.edu/page/data

Climographs - NDMC
Thirty year monthly averages of precipitation and temperature for selected locations across the United State and around the world.

30-Year Climate Normals - HPRCC
The High Plains Region Normals Maps include maps of precipitation, average temperature, maximum temperature, minimum temperature, heating degree days, and cooling degree days. The 1981-2010 Normals were used to comprise the maps.

Climate Atlas Maps - HPRCC
The High Plains Climate Atlas is composed of a series of maps with various climatic variables being represented. In most instances, 50 years of data were used to comprise the atlas. Maps include mean maximum temperature, mean minimum temperature, precipitation thresholds, last spring freeze, first fall freeze, growing degree days (base 50), total precipitation, total snowfall, heating degree days, and cooling degree days.
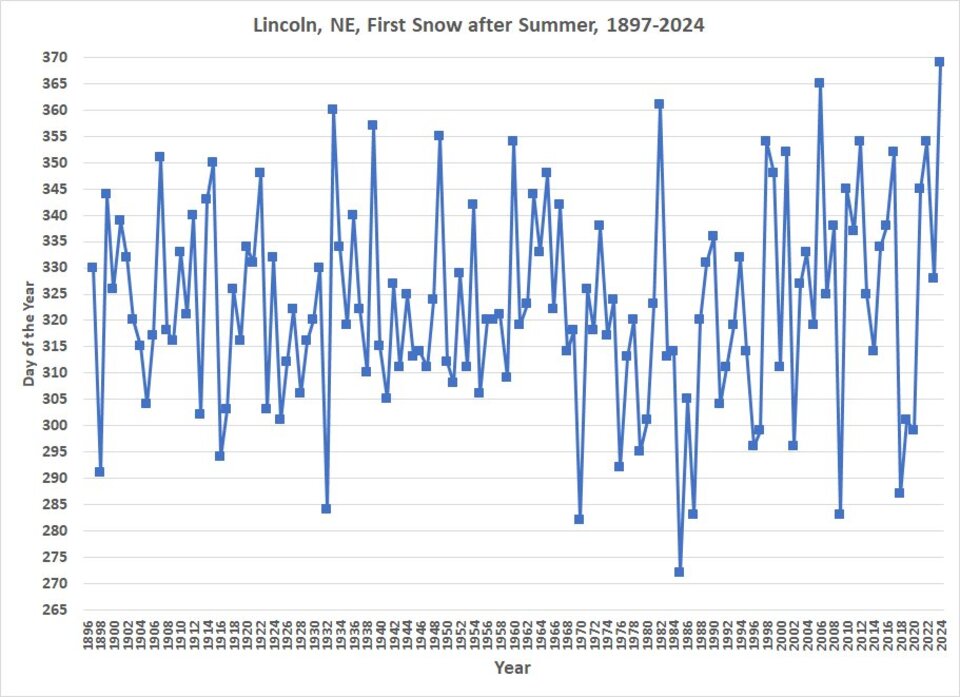
Lincoln, Nebraska, Climatologies - Snowfall
Analysis of the 1887 to present Lincoln data archive with precipitation (rain and snowfall), temperature, and growing season climatologies.
Website: https://lincolnweather.unl.edu/climate-data/snowfall/
National Atmopsheric Deposition Network
We participate in the National Atmospheric Deposition Program (NADP), which provides long term spatial and temporal trends in precipitation chemistry in the United States. Data are available from samples collected at two locations in Nebraska: 1) our station (Site NE15) located at the Agrometeorology lab at University of Nebraska Agricultural Research and Development Center (ARDC) near Mead is one of the original collection site in the network beginning in July of 1978 and 2) a site at the North Platte Agricultural Experiment Station (NE99) near North Platte that has been collecting data since 1985.
Website: https://nadp.slh.wisc.edu/
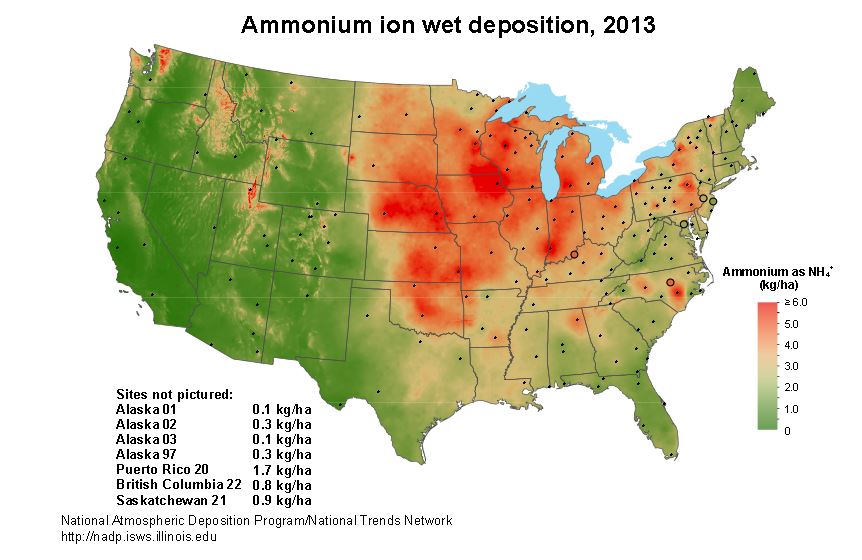
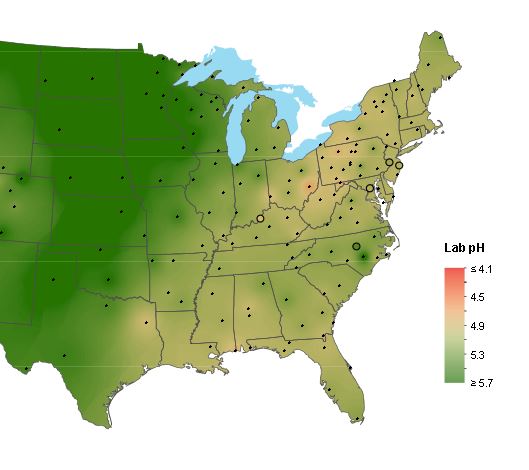
National Trends Network - Acids, Bases & Nutrients
Sites predominantly are located away from urban areas and point sources of pollution. Each site has a precipitation chemistry collector and gage. The automated collector ensures that the sample is exposed only during precipitation (wet-only-sampling).
Site operators follow standard operational procedures to help ensure NTN data comparability and representativeness. They collect samples weekly on Tuesday morning, using only containers cleaned at the Central Analytical Laboratory (CAL) at the Illinois State Water Survey (ISWS). They weigh the collection bucket to determine sample volume and transfer the sample from the collection bucket to a shipping bottle. All samples are sent to the CAL for analysis, and data entry, verification, and screening.
The CAL measures free acidity (H+ as pH), conductance, calcium (Ca2+), magnesium (Mg2+ ), sodium (Na+ ), potassium (K+ ), sulfate (SO42-), nitrate (NO3+ ), chloride (Cl- ), and ammonium (NH4+). The CAL also measures orthophosphate, but only for quality assurance as an indicator of sample contamination.
Website: https://nadp.slh.wisc.edu/ntn/
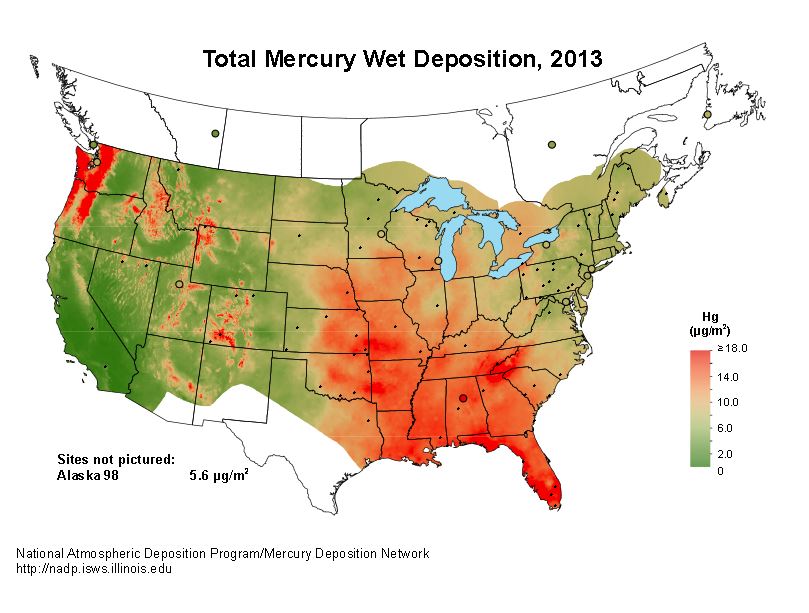
Mercury Deposition Network
The MDN is the only network providing a long term record of total mercury (Hg) concentration and deposition in precipitation in the United States and Canada. All MDN sites follow standard procedures and have uniform precipitation chemistry collectors and gages. The automated collector has the same basic design as the NTN collector but is modified to preserve mercury. Modifications include a glass funnel, connecting tube, bottle for collecting samples, and an insulated enclosure to house this sampling train. The funnel and connecting tube reduce sample exposure to the open atmosphere and limit loss of dissolved mercury. As an additional sample preservation measure, the collection bottle is charged with 20 mL of a one percent hydrochloric acid solution.
Site operators collect samples Tuesday morning or daily within 24 hours of the start of precipitation. With each MDN sample, the entire sampling train is replaced with one that is cleaned by the Mercury Analytical Laboratory (HAL) at Frontier Geosciences, Inc., Seattle, Washington. Rigorous cleaning ensures that each sampling train component is essentially mercury-free. The HAL supplies the collection bottles already charged with the hydrochloric-acid preservative. By following those procedures and stringent sampling protocols, the MDN is able to report mercury concentrations below 1 part per trillion (< 1 nanogram/liter).
Data are available from samples collected at two locations in Nebraska: 1) our station (Site NE15) located at the Agrometeorology lab at University of Nebraska Agricultural Research and Development Center (ARDC) near Mead began collection data in June 2007 and 2) a site at the North Platte Agricultural Experiment Station (NE99) near North Platte that has been collecting data since October 2008.
Website: https://nadp.slh.wisc.edu/mdn/