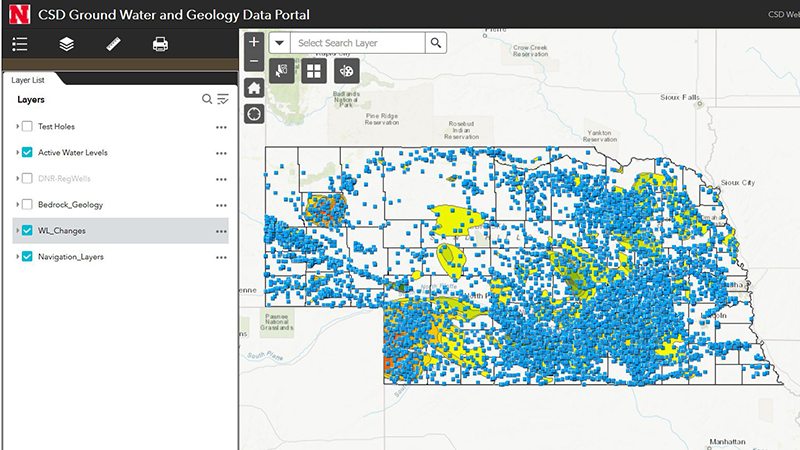
Interactive Data Map
The CSD Interactive Data Map is a simple online Geographic Information System that allows the user to overlay various data sets to aid in decision making and answer basic questions regarding Nebraska’s Natural Resources and Geology. Currently, the following layers are available: groundwater levels, groundwater level changes, test hole data, registered wells and basic geologic maps. Other CSD datasets will be added to the map as they become available.
View Map and Tutorials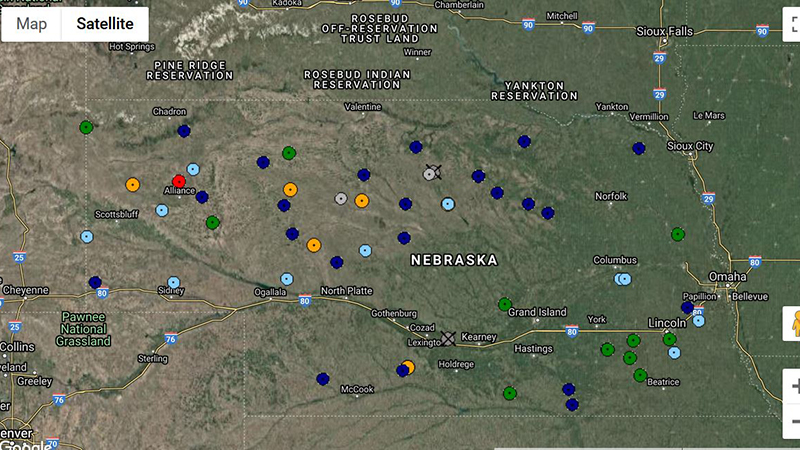
Real-Time Groundwater Monitoring Network
The program collects groundwater-level information from a network of 64 automated observation wells, which take depth to water readings, upload information to the internet, and map water-level changes on an hourly basis. Click an icon for site specific information.
View Map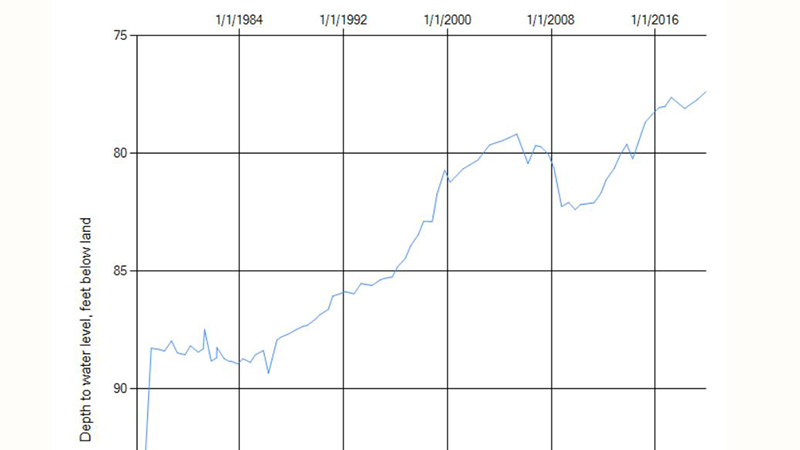
Historic Groundwater Levels
Since 1930, the Conservation and Survey Division has overseen the Nebraska Groundwater-Level Monitoring Program. As part of this program, the CSD along with it’s cooperating agencies have collected water-level data from more than 24,000 wells statewide. A database containing the wells and associated water level data is available here for download. Data is collected as a cooperation between the CSD, the USGS, all 23 Nebraska’s NRDs, Central Nebraska Public Power and Irrigation District, and the US Bureau of Reclamation.
Get Data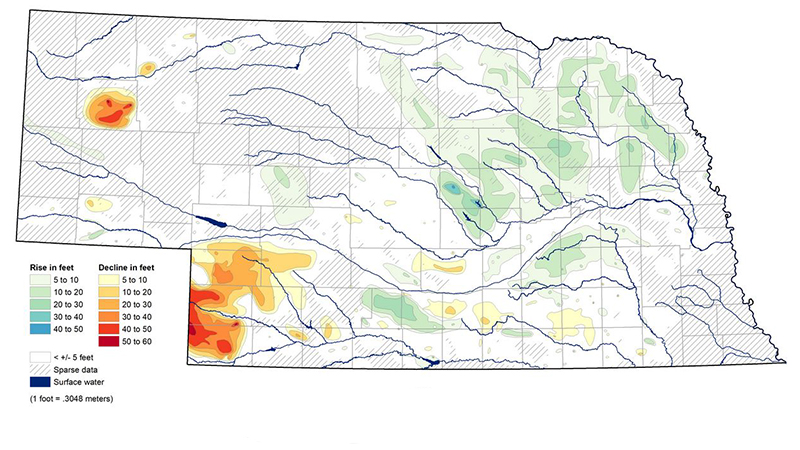
Groundwater Level Changes Maps
A series of maps for groundwater water level changes over the previous year, 5 years, 10 years and since 1981.
Age & Transport
Groundwater quality is an ever-present concern in Nebraska as the majority of the state’s drinking water is sourced from groundwater. Since the mid-1900’s, areas of Nebraska have been subjected to surface activities that have led to elevated nitrate concentrations in groundwater. Shallow aquifers with soils and geology that allow for rapid recharge are often the first to have groundwater with higher nitrate concentrations. However, deeper groundwater systems are not immune to contaminants. Often, the longer a groundwater system is subjected to nitrate and pesticides, the greater the risk of higher concentrations.
Learn More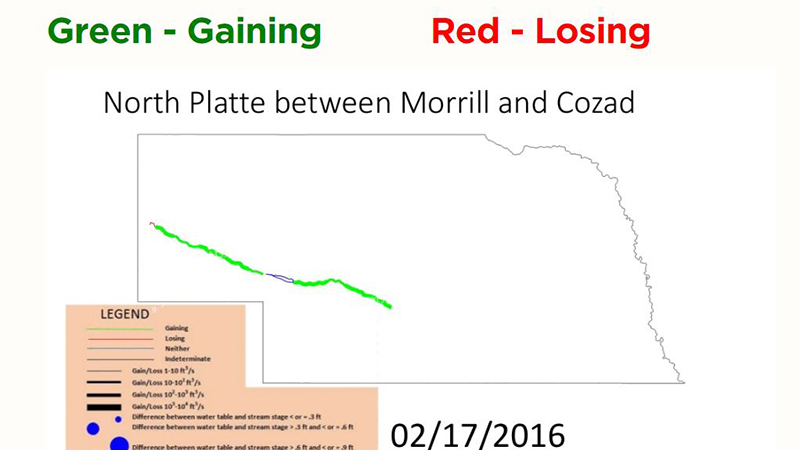
Stream Gain and Loss
The animations depict “apparent” gaining and losing reaches in Nebraska, based on Nebraska DNR and USGS stream gage data. "Apparent" gains or losses are calculated from gaged flows only, and may be influenced by ungauged tributaries or canal diversions. Green reaches indicate that more water is coming into the reach than is leaving the reach (gaining condition) and red indicates the opposite (losing) condition. The width of the lines indicate the magnitude of apparent gains or losses within a given month. Data from June 2015 through June 2016 were used to construct the animation.
View Animation