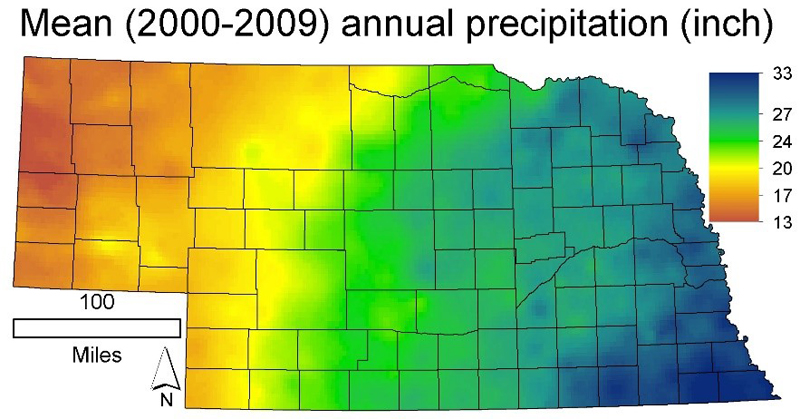
Mean annual precipitation (P) distribution over Nebraska. The south-eastern corner receives two-and-a-half times as much precipitation a year in general as the north-western panhandle region.
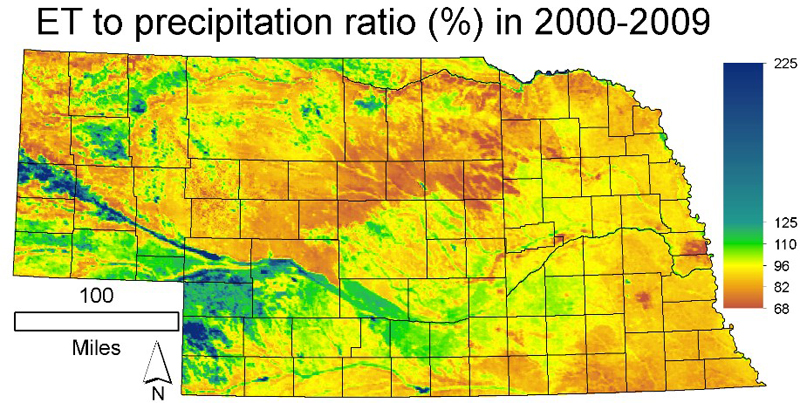
The mean annual ET-ratio relates evapotranspiration (ET) to precipitation rates on an annual basis. Normally the ET-ratio (ET / P) is less than unity over land, but over water-logged (lakes, swamps, wet meadows) or heavily irrigated areas or in regions where the groundwater is close to the surface and the vegetation taps it, it may be larger than one. When precipitation is scarce, as in the western part of Nebraska, ET rates may exceed precipitation by 100% due to large-scale heavy irrigation. Check out the low ET-ratio values near the eastern flank of the Sandhills, proving how much the sand acts like a sponge.
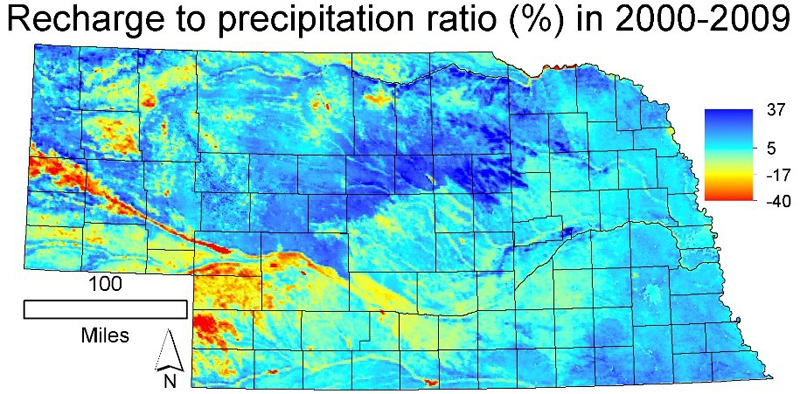
Recharge (R) to the groundwater here is estimated on a mean annual basis as P – ET – Ro, where Ro denotes surface runoff. R becomes negative in areas where ET > P. Again, the Sand Hills region stands out with its high recharge to precipitation ratios. Check out the snake-like elongated feature characterized by high recharge ratios just west of Columbus along the southern side of the Loup River. Those are sand hills as well.
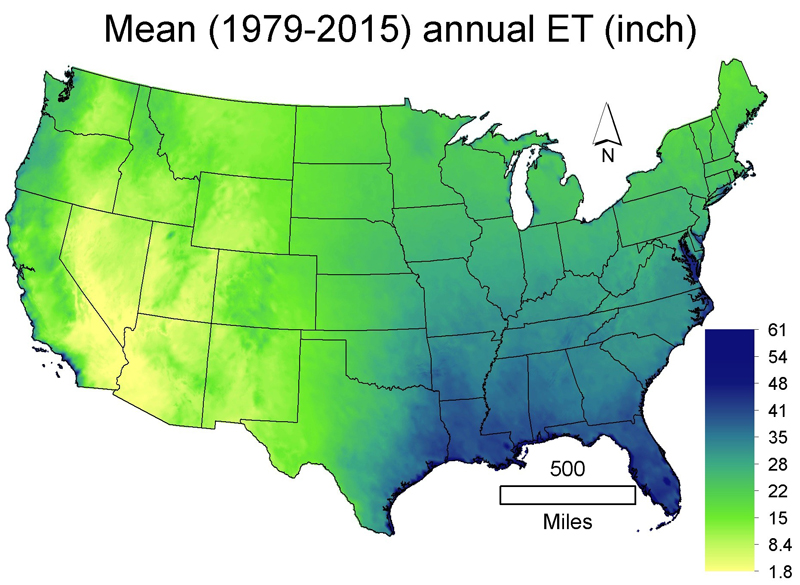
The conterminous US-wide ET-rate estimates are based on the calibration-free generalized complementary relationship (GCR) of evaporation. As of today GCR represents one of the most accurate regional/continental scale ET estimation approaches. The Grand Canyon, with its depressed ET rates is visible in the map, as are the Great Salt Lake in Utah and Lake Okeechobee in Florida with their elevated value.