High Plains Analysis
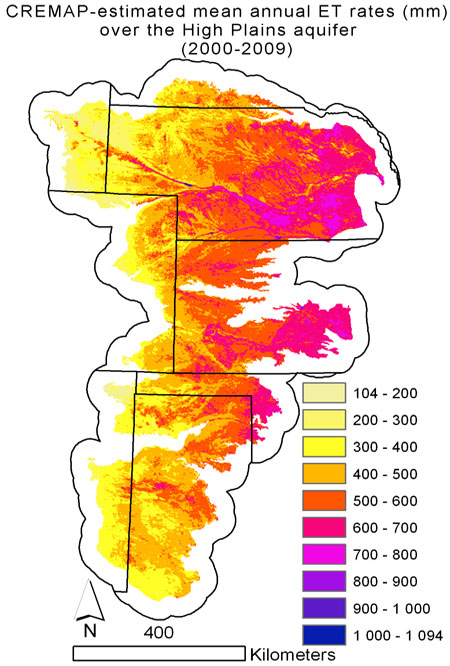
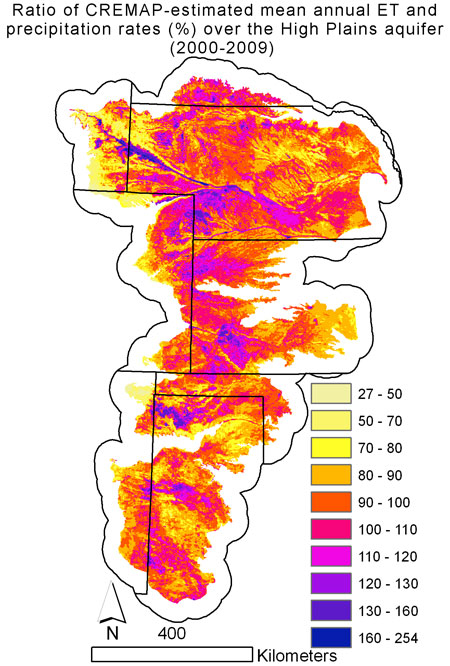
This contains two graphic (in tiff format) files showing the mean annual ET distribution over the High Plains aquifer, estimated by the CREMAP method of the author.
Downloads
A short technical explanation of CREMAP and the data employed are also included in an additional document.
Nebraska Analysis
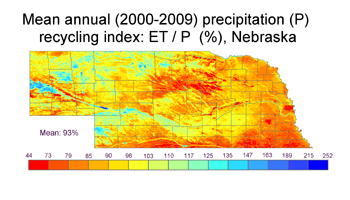
This two images show the mean annual ET distribution over Nebraska, estimated by the CREMAP method of the author.
Downloads
| Monthly CREMAP ET estimates (mm) for the March-November period each year within 2000-2009 | Monthly ET Estimates |
| WREVAP documentation with the original FORTRAN source code of Morton et al. (1985) | WREVAP documentation |
| A short technical explanation of CREMAP and the data employed. | technical explanation |
Publications
When using CREMAP or the ET estimates of this site, reference is to be given to the following publications:
- Szilagyi, J., Jozsa, J., 2009. Estimating spatially distributed monthly evapotranspiration rates by linear transformations of MODIS daytime land surface temperature data. Hydrol. Earth System Sci., 13(5), 629-637.
- Szilagyi, J., Kovacs, A., 2010. Complementary-relationship-based evapotranspiration mapping (CREMAP) technique for Hungary, Periodica Polytechnica Civil Engineering, 54(2), 95-100.
- Szilagyi, J., Kovacs, A., 2011. A calibration-free evapotranspiration mapping technique for spatially-distributed regional-scale hydrologic modeling, Journal of Hydrology and Hydromechanics, 59(2), 118-130.
- Szilagyi, J., Kovacs, A., Jozsa, J., 2011. A calibration-free evapotranspiration mapping (CREMAP) technique, in Labedzki, L (ed.) Evapotranspiration, INTECH, Vienna, Austria, ISBN 978-953-307-251-7, http://www.intechopen.com/books/evapotranspiration
Contacts


This data is collected, administered, and provided by the Conservation and Survey Division.


